058
The Next Step Beyond NPS (Net Promoter Score)


A common metric leveraged in commercial diligence – NPS (Net Promoter Score) – is based on a single and simple question presented to users of a good or service: “On a score of 0 to 10, how likely is it that you would recommend [XYZ] to a friend or colleague?” The metric and the question are designed to measure current satisfaction, and the design logic of the question (and the associated measurement system) is to frame a hypothetical, knowing that it is natural human tendency to protect personal brand and reserve offering positive recommendation only in cases where satisfaction levels are unusually high. The hypothetical and the associated calculation are designed for a high bar (to test satisfaction levels).
In this piece, we focus on the importance of truly understanding a target company’s satisfaction, how to use NPS to measure going forward prospect (through thoughtful follow-up questions that I use), and what it means for a potential investment and your post-acquisition value generation plans.
Too often, the satisfaction and loyalty discussion included in CIMs and sell-side diligence starts and ends with NPS and misses a significant opportunity to (very efficiently) get more from the measure and associated themes – by adding a few additional follow-on questions, diligence can get substantially further with more valuable insights.
I recommend adding the following loyalty and price-value questions (and analytics):
1. The Loyalty/Stickiness Follow-on Question: “How likely are you to switch away from [XYZ] product or service in the next year?” Measuring the likelihood of switching is important in any strategy or diligence engagement, but juxtaposing the likelihood of switching with a respondent’s NPS can create important insights.
-
High(er) NPS (relative to competition) combined with High likelihood to switch: This may suggest that while a product or service is highly regarded, there are equally well-regarded solutions on the market and the process of switching is not arduous enough to create stickiness; in these cases, there needs to be a viable route to taking share from competitors (who may have the same characteristic) while also creating “hooks” with our customers to convince them to stay put
-
As an example: I absolutely LOVE Spotify. It’s a 10 on the NPS scale for me. But if a competitor came around at a lower price point, with the simple ability to transfer my playlists? Sorry Spotify, but I’m out the door (even though my Wrapped suggests I’m in the 99th percentile for time spent listening)
-
-
Low(er) NPS combined with Low likelihood to switch: If you only look at the NPS score in this case, this business may look like a dud. However, when comparing NPS with switching behavior, the greater insight is that despite low satisfaction, switching is rare – suggesting a lack of viable alternatives, a very painful switching process, and/or a very painful problem that the product is addressing (and therefore any gain is a valuable win)
-
High(er) NPS combined with Low likelihood to switch: This begs the question: can you deposit a high NPS score at the bank? Not yet. Which begs a second question: is pricing where it should be? They’ve earned a great reputation, it’s less likely that customers are going anywhere (but be forewarned, segmentation and creating price point options are very likely needed before taking action), and its potentially time to understand if there is room to increase pricing
-
Low(er) NPS combined with High likelihood to switch: Sometimes, discretion is the better part of valor. Unless there are concrete steps that can be taken rapidly to right the ship, these are businesses worth steering away from. The combination of a wave of switching plus a lackluster NPS suggest the business you’re looking at may not be worth the risk
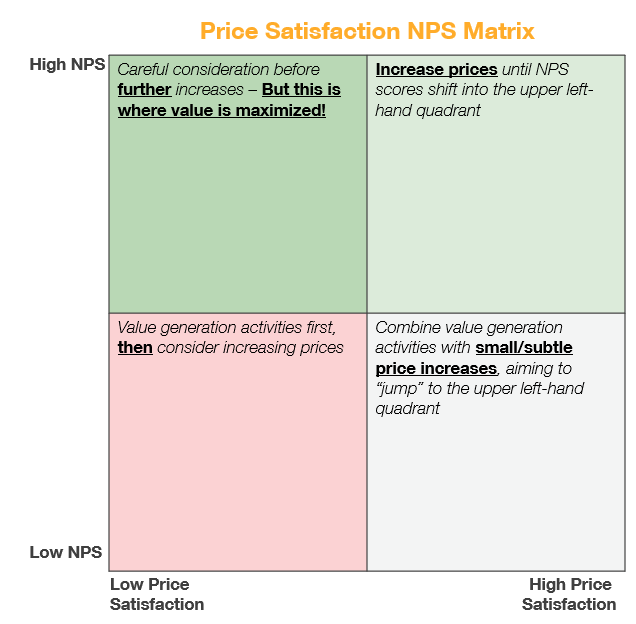
2. The Price-Value Follow-on: “Given your experience, with X, how reasonable do you think [XYZ] product or service’s pricing is?” As noted above: you can’t deposit a high NPS at the bank. Measuring satisfaction with current pricing and comparing it to NPS can reveal businesses where price (and how much) increases might be most well received. Furthermore, assessing NPS and price satisfaction in a simple 2x2 can help illustrate next steps for a value generation plan post-acquisition:
I would love to have ongoing conversation about how to better put NPS to use, – given its popularity, so please share back any ideas, frustrations, or questions.
Copyright © GRAPH Strategy LLC